Safety Stock for Spare Parts: What to Calculate, What to Automate, and What Most Plants Get Wrong
Introduction – Safety Stock Is Where Risk and Capital Collide
Most plants believe they are protecting uptime by increasing safety stock.
In reality, many are protecting uncertainty.
Safety stock for spare parts exists to absorb variability in demand and lead time. It is not meant to compensate for poor visibility, inconsistent criticality classification, or static ERP assumptions.
When safety stock is calculated incorrectly, two outcomes emerge:
- Excess non-critical inventory inflates working capital
- Mission-critical assets remain exposed to stockout risk
For enterprise organizations operating multiple sites, safety stock misalignment can represent millions in avoidable carrying cost while still leaving operational gaps.
If you want to evaluate whether your current spare parts safety stock policies reflect real operational risk, schedule a strategic review here.
This guide breaks down what safety stock for spare parts should include, what calculations matter at enterprise scale, what should be automated, and where most plants get it wrong.
What Safety Stock for Spare Parts Is – And Is Not
Safety stock is a statistical buffer designed to protect against variability.
It is calculated based on:
- Demand variability
- Lead time variability
- Desired service level
It is not:
- A blanket percentage increase
- A reaction to one historical outage
- A substitute for poor data governance
When safety stock becomes an emotional response rather than a calculated decision, capital expands without improving reliability.
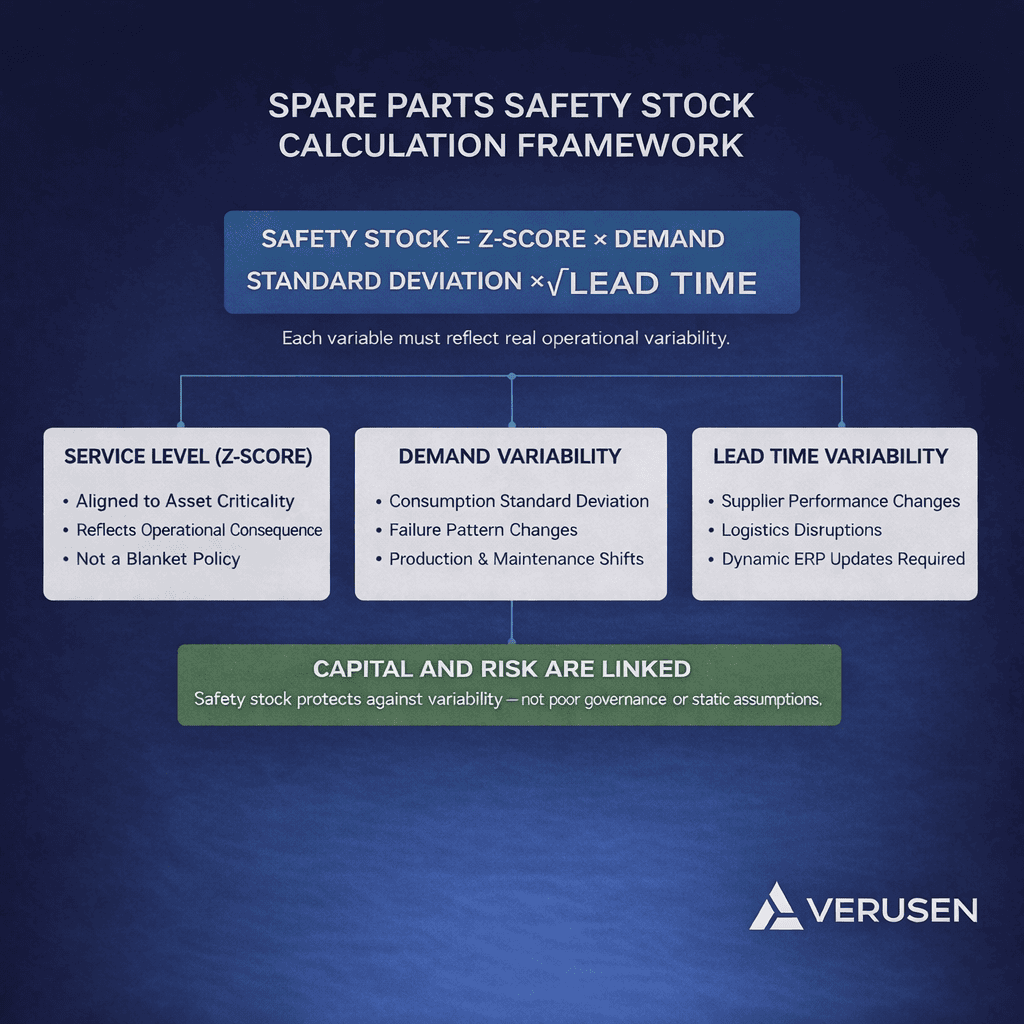
The Core Calculation – And Why It Must Be Dynamic
The foundational formula for safety stock is:
Safety Stock = Z-score × demand standard deviation × √lead time
Each variable matters.
1 – Z-Score Must Reflect Operational Criticality
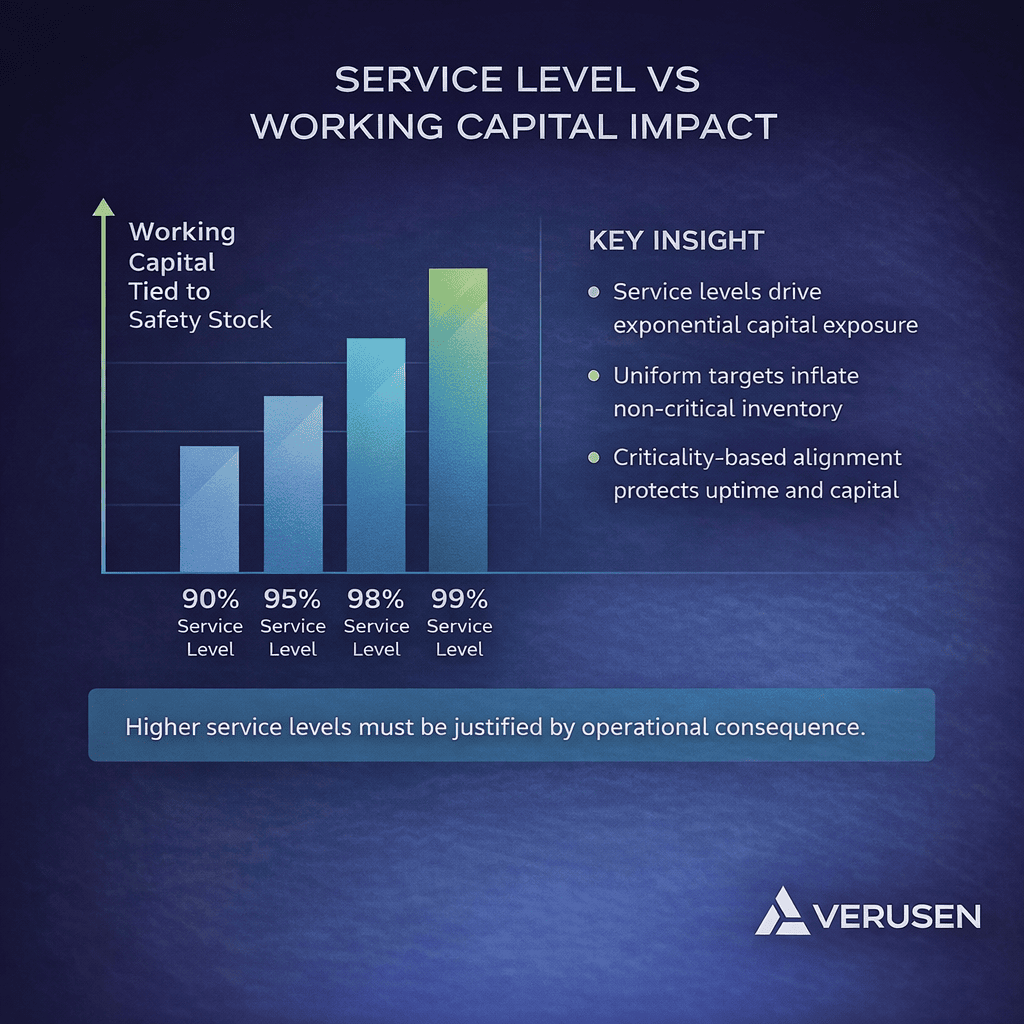
The Z-score corresponds to service level targets.
For example:
- 90 percent service level ≈ Z-score of 1.28
- 95 percent service level ≈ Z-score of 1.65
- 98 percent service level ≈ Z-score of 2.05
Applying a 98 percent service level to every spare part inflates inventory dramatically.
Service levels should align with asset criticality, not blanket policy.
2 – Demand Variability Must Be Accurate
Demand standard deviation must reflect real consumption patterns.
Many plants rely on outdated historical averages without recalibrating for:
- Equipment aging
- Maintenance program changes
- Production increases
If variability is overstated, safety stock becomes inflated.
If understated, stockout risk increases.
3 – Lead Time Must Be Continuously Updated
Lead time variability is frequently ignored.
If supplier lead time shifts from 30 days to 75 days, safety stock requirements change significantly due to the square root relationship.
Static ERP lead times create a false sense of protection.
Dynamic lead time monitoring is essential for enterprise spare parts safety stock management.
Where Most Plants Get Safety Stock Wrong
Mistake 1 – Uniform Service Levels Across All SKUs
Applying a uniform 95 percent service level across thousands of spare parts ignores operational consequence.
Non-critical parts become overprotected. Critical parts remain underanalyzed.
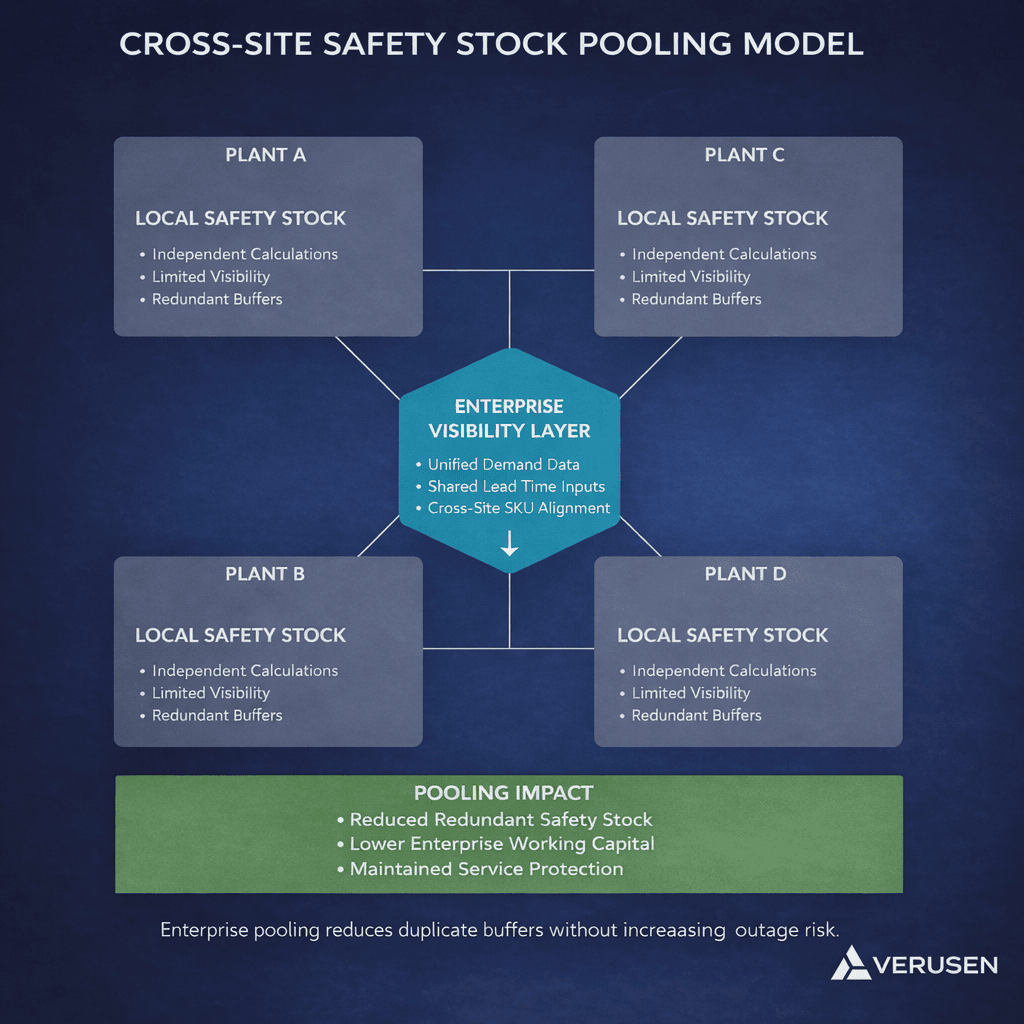
Mistake 2 – Ignoring Cross-Site Pooling Opportunities
In multi-site organizations, safety stock is often calculated independently at each plant.
This results in:
- Redundant buffer stock
- Inflated enterprise-wide safety stock
When visibility is unified, safety stock can often be reduced through cross-site pooling while maintaining availability.
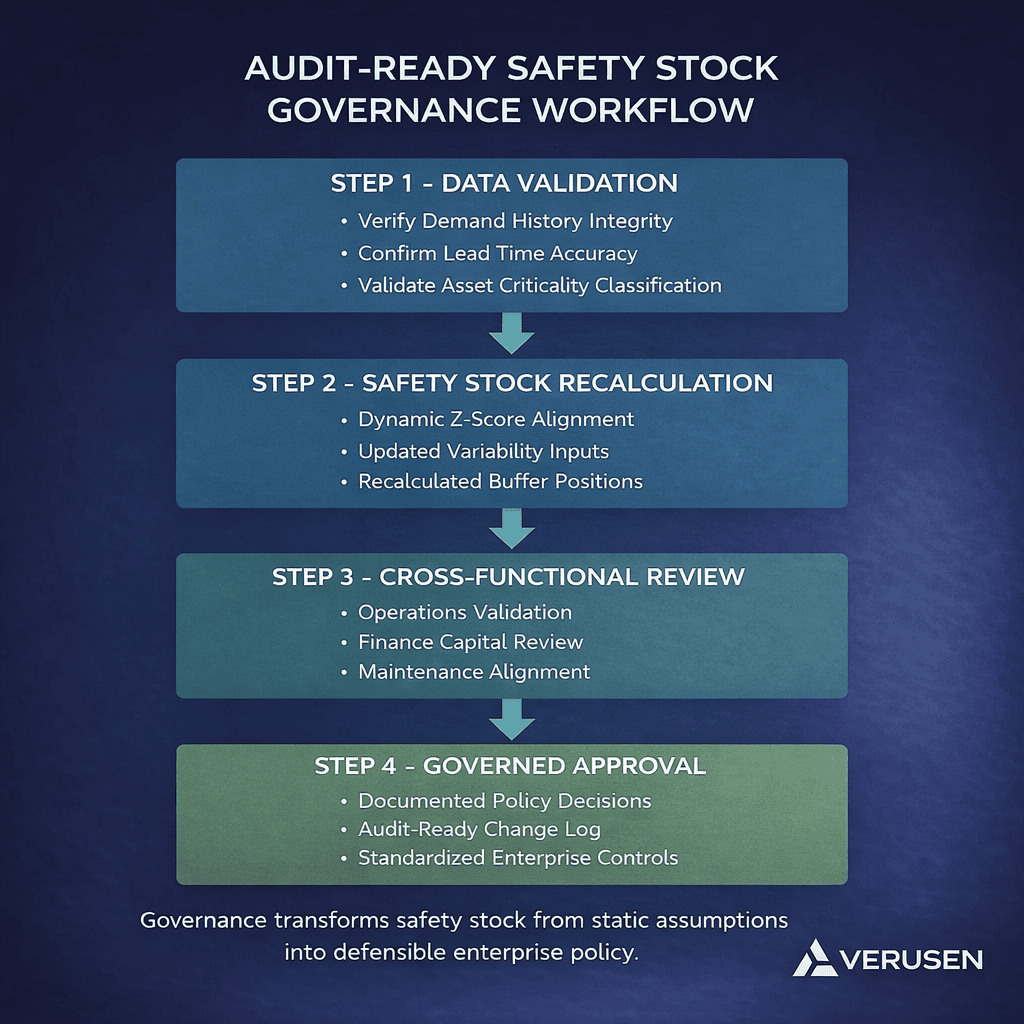
Mistake 3 – Treating Safety Stock as Static
Safety stock policies are often set once and left untouched for years.
But variability evolves.
Enterprise safety stock management must include:
- Ongoing recalibration
- Audit-ready review workflows
- Cross-functional oversight
Without governance, drift returns.
What Should Be Automated in Spare Parts Safety Stock Management
Enterprise-scale spare parts safety stock cannot be managed manually.
Automation should include:
- Continuous recalculation of safety stock based on updated lead times
- Alerts for significant variability shifts
- Identification of over-max inventory positions
- Risk scoring tied to asset criticality
- Executive-level reporting on capital exposure and risk alignment
Manual spreadsheet reviews are insufficient at enterprise SKU volumes.
If your organization wants to evaluate whether safety stock is being dynamically aligned across all sites, you can request a focused analysis here.
Financial Impact – Safety Stock Misalignment at Scale
Consider a utility or industrial enterprise with:
- $180 million in MRO inventory
- 25 percent of that categorized as safety stock
- 20 percent carrying cost
Safety stock inventory = $180M × 25 percent = $45M
Annual carrying cost = $45M × 20 percent = $9M
If improved criticality alignment and dynamic recalculation safely reduce safety stock by 15 percent:
Reduction = $45M × 15 percent = $6.75M
Annual carrying cost impact = $6.75M × 20 percent = $1.35M
This excludes avoided outage impact due to better positioning of mission-critical spares.
Safety stock decisions are capital allocation decisions.
Case Study – Power and Utility Provider Verified $29.7M in Inventory Value Through Modernized Criticality and Workflow
A Fortune 500 power and utility provider struggled with outdated stocking models and inconsistent spare parts governance.
Challenges included:
- Working capital overextended on non-critical spare parts
- Budget constraints limiting availability of truly critical components
- Inventory decisions difficult to defend during audits
- Manual workflows relying on spreadsheets and emails
Despite significant safety stock levels, alignment to asset criticality was inconsistent.
By implementing a unified, AI-driven inventory optimization platform with configurable parts criticality and audit-ready workflows, the organization:
- Identified $40M in inventory value
- Verified $29.7M in inventory value reduction
- Reviewed 45,000 materials in under one year
- Enabled 100 percent audit capability for material inventory decisions
Modernized safety stock recalibration tied to operational and regulatory risk allowed the organization to reduce excess non-critical inventory while strengthening governance over mission-critical parts.
The result was measurable capital impact and improved compliance confidence.
FAQs
No. Enterprise environments rarely begin with perfect data. Harmonizing existing ERP information into a centralized analytical layer allows recalibration of safety stock using real consumption and lead time inputs.
Not when recalibration is tied to asset criticality and dynamic lead times. The objective is not blanket reduction. It is realignment of buffer stock to operational consequence.
No. Enterprise safety stock optimization works alongside existing ERP and EAM systems, unifying data without system replacement.
Organizations typically identify misaligned safety stock positions early in the review process. Verified financial reductions depend on governance implementation cadence, but visibility improvements are immediate.
Conclusion
Safety stock for spare parts should protect uptime, not protect uncertainty.
When service levels align with criticality, lead times are dynamically monitored, and governance is standardized, organizations reduce capital while strengthening operational confidence.
If your enterprise has not recalibrated safety stock across sites using dynamic inputs, there is likely measurable opportunity. Schedule a strategic safety stock evaluation here.