How to Calculate Safety Stock for Spare Parts (And Why Most Formulas Fail)
Introduction
Most organizations believe they are calculating safety stock correctly.
They are using the right formula.
They are applying the right service levels.
They are pulling data from their ERP.
And they are still getting it wrong.
Because the problem is not the formula.
It is the assumptions behind it.
Safety stock calculations fail in enterprise environments not because the math is incorrect, but because the inputs are outdated, incomplete, or disconnected from operational reality.
If you are managing spare parts across multiple plants, the question is not how to calculate safety stock.
It is how to calculate it in a way that reflects real risk.
Book a call to evaluate whether your current safety stock calculations reflect real-world variability and operational impact.

The Standard Safety Stock Formula (And Its Limits)
The most widely used formula is:
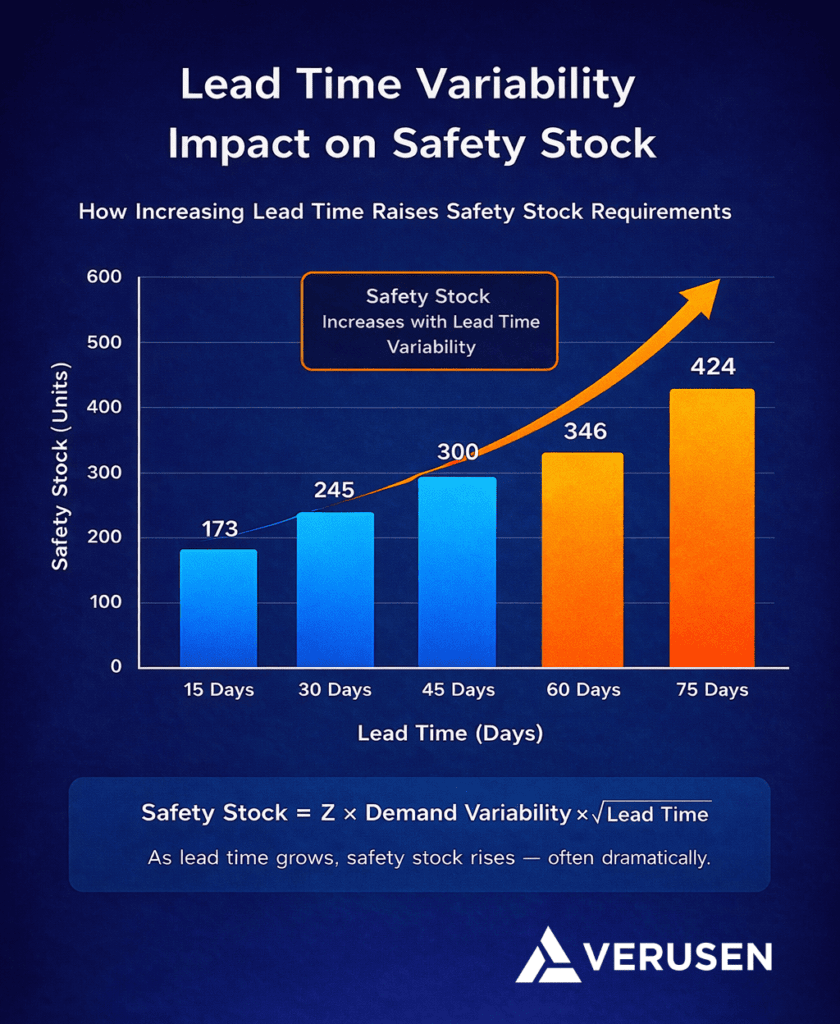
Safety Stock = Z score × demand variability × square root of lead time
On paper, this is correct.
It accounts for:
- Service level targets (Z score)
- Demand variability
- Lead time variability
But the formula assumes something critical.
It assumes your inputs are accurate and current.
In most enterprise environments, they are not.

Where the Formula Breaks Down
The formula fails when:
- Lead times are static
- Demand variability is poorly measured
- Service levels are applied uniformly
- Criticality is not incorporated
When these conditions exist, the formula produces outputs that look precise but are fundamentally misaligned.
That is how organizations end up with excess inventory and stockouts at the same time.
Why Most Safety Stock Calculations Fail
1. Static Lead Time Assumptions
Lead time is one of the most volatile inputs in the formula.
Supplier performance changes. Logistics conditions shift. Global disruptions introduce variability.
Yet most ERP systems treat lead time as a fixed value.
If lead time increases from 30 days to 75 days and the system does not update, safety stock becomes insufficient.
If lead time decreases and safety stock remains unchanged, excess inventory accumulates.
The formula is correct.
The input is wrong.
2. Misunderstood Demand Variability
Demand variability for spare parts is not smooth.
It is intermittent, unpredictable, and often driven by failure events.
Traditional statistical approaches assume normal distribution.
Spare parts demand rarely behaves that way.
This leads to:
- Overestimation of variability for some parts
- Underestimation for others
Both scenarios create risk.
3. Uniform Service Levels Across All Parts
Applying a blanket service level across thousands of SKUs assumes equal consequence of failure.
It is convenient.
It is also incorrect.
A low-value consumable and a mission-critical component should not share the same service level target.
Without criticality alignment:
- Non-critical parts are overstocked
- Critical parts remain under-protected

4. No Link to Operational Consequence
Most safety stock calculations are purely mathematical.
They do not account for:
- Downtime cost
- Production impact
- Safety implications
This disconnect creates decisions that are statistically valid but operationally flawed.
What Accurate Safety Stock Calculation Actually Requires
1. Dynamic Lead Time Updates
Lead time must be continuously updated based on real supplier performance.
This includes:
- Historical variability
- Recent changes
- Supplier reliability trends
Static inputs create outdated outputs.
2. Intermittent Demand Modeling
Spare parts require models that account for irregular demand patterns.
This means:
- Recognizing non-normal distributions
- Adjusting variability calculations accordingly
Without this, safety stock becomes disconnected from actual usage.
3. Criticality-Aligned Service Levels
Service levels should be based on operational impact.
This requires evaluating:
- Safety risk
- Production downtime cost
- Asset redundancy
- Lead time risk
Service levels should vary based on consequence.
4. Integration of Financial Impact
Safety stock is a capital decision.
Every unit of inventory carries cost.
Calculations must incorporate:
- Carrying cost
- Opportunity cost of capital
- Cost of stockout
Without this, decisions cannot be optimized.
Schedule a working session to review your current safety stock formulas and identify where assumptions are creating misalignment.

The Financial Impact of Misaligned Calculations
Consider an enterprise with:
- $180M in MRO inventory
- 25 percent allocated to safety stock
- 20 percent carrying cost
That equals:
- $45M in safety stock
- $9M annually in carrying cost
If safety stock is miscalculated by even 15 percent:
- $6.75M in excess or insufficient inventory
- $1.35M annual cost impact
And that does not include downtime risk.
Small errors in calculation scale into large financial consequences.
Case Study – When the Formula Was Not the Problem
A Fortune 500 power and utility provider faced significant inventory challenges.
Their safety stock calculations followed standard formulas.
Their issue was not methodology.
It was input accuracy and governance.
Lead times were outdated. Demand variability was poorly modeled. Criticality was inconsistently applied.
The organization implemented a structured approach:
- Reviewed 45,000 materials across the enterprise
- Updated lead time and demand inputs
- Aligned service levels to operational consequence
- Introduced governance for traceability
The results:
- $40M in inventory value identified
- $29.7M in verified inventory reduction
- Full audit capability across inventory decisions
The formula did not change.
The inputs did.
And that changed everything.
FAQs
Yes. The formula is mathematically sound. The issue is typically the accuracy and relevance of the inputs used.
It should be recalculated whenever lead times or demand variability change. In practice, this requires continuous or periodic updates rather than static annual reviews.
While calculations can be done manually, enterprise environments benefit significantly from platforms that automate data updates and apply advanced modeling.
By aligning service levels to criticality, updating lead times dynamically, and validating changes through governance processes.
Conclusion
Safety stock calculation is not a math problem.
It is a data and alignment problem.
Organizations that rely on static inputs will continue to carry excess inventory and face unexpected stockouts.
Those that align inputs to reality will reduce capital while improving reliability.
If your current calculations cannot be clearly explained or defended, they are likely misaligned.
Talk with our team about evaluating your safety stock calculations and identifying where adjustments can reduce risk and capital.